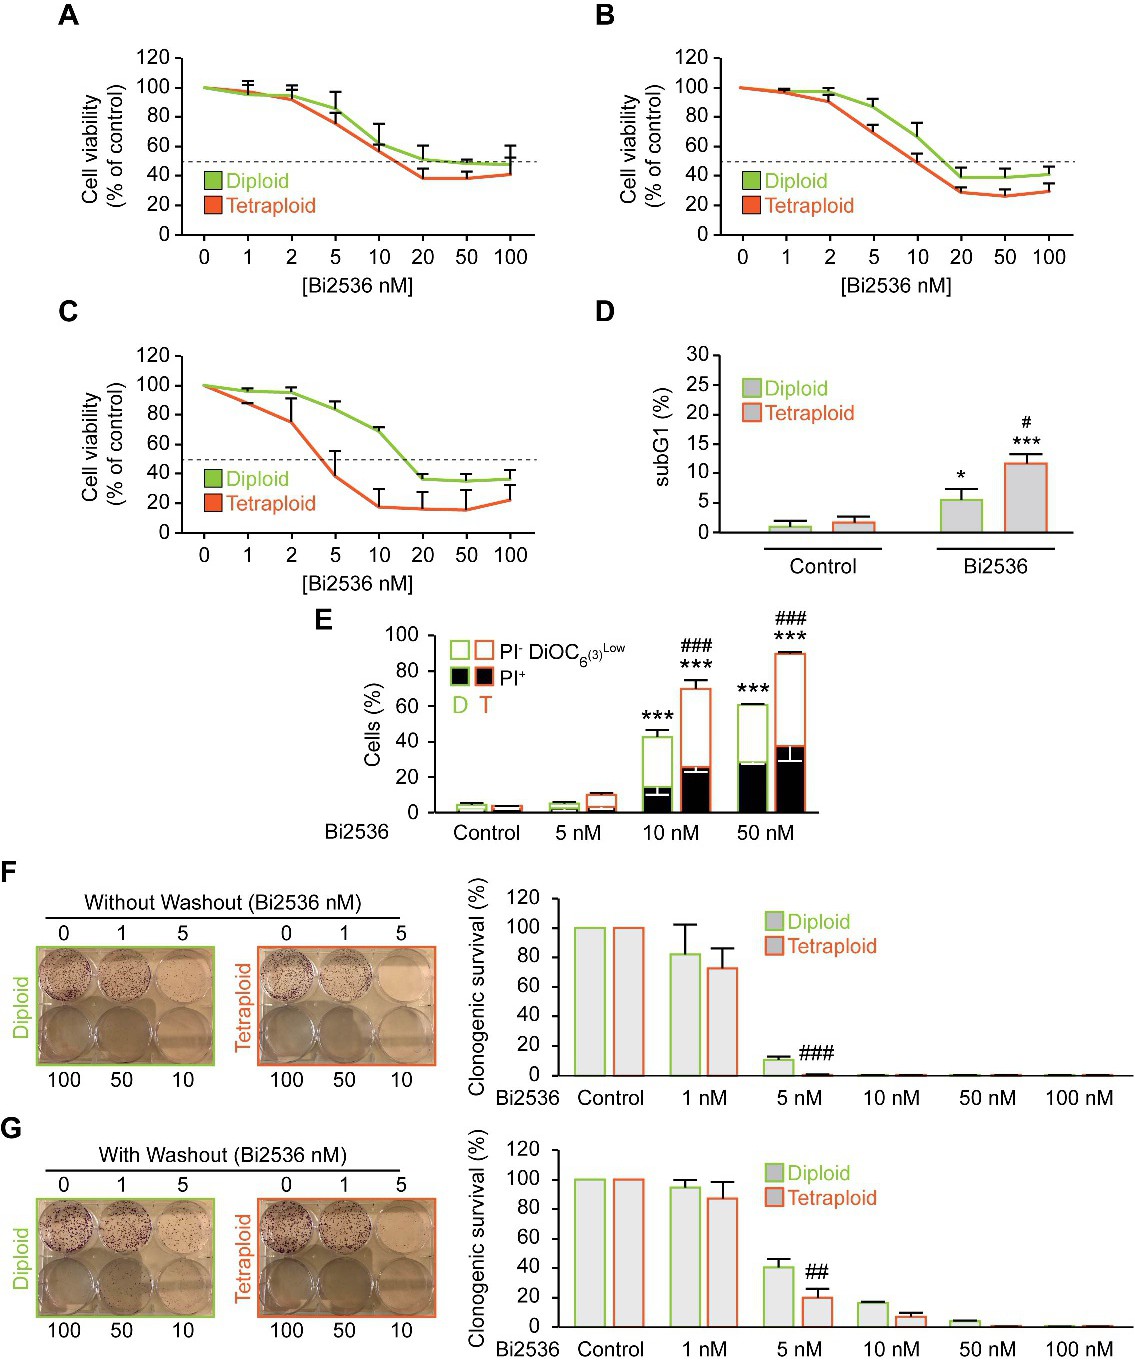
Fig. 2. Preferential killing of tetraploid cells after PLK1 chemical inhibition. A-C. Diploid and tetraploid RKO cells were exposed to DMSO control or increasing doses of the PLK1 inhibitor Bi2536 for 24 h (A), 48 h (B), or 72 h (C) before analysis with a crystal violet assay. D. Diploid and tetraploid RKO cells were treated with DMSO or 10 nM Bi2536. The subG1 cell population was detected by flow cytometry upon fixation and propidium iodide (PI) staining after 72 h treatment. E. Diploid and tetraploid RKO cells were treated with DMSO or 5, 10 or 50 nM Bi2536 for 72 h before co-staining with PI and the mitochondrial membrane potential (Δψm)-sensing dye DiOC6(3) for the evaluation of cell death by cytofluorometry. The white and black columns depict the percentage of dying (PI−DiOC6(3)low) and dead (PI+) cells, respectively. F-G. Diploid and tetraploid RKO cells were seeded at low concentration for a clonogenic assay. The cells were treated with DMSO as a control or 1, 5, 10, 50 or 100 nM Bi2536 and cultivated for 15 days, without (F) or with a 24 h drug washout (G) before crystal violet staining and colony counting. Representative images for each condition are showed in panel and quantitative data of clonogenic survival comparatively to control are represented. Data are reported as means ± SD (n ≥ 3). ***p<0.001, **p<0.01, *p<0.05 (Mann-Whitney test), as compared to the control. ###p<0.001, ##p<0.01, #p<0.05 (Mann-Whitney test), as compared to diploid subjected to the same treatment condition.